Landsat Reveals Reservoir Changes and Bathymetry
Communities worldwide rely on reservoirs for drinking water, hydroelectric power, irrigation, and more. These critical freshwater resources are affected by seasonal and long-term changes; water levels in reservoirs can dip during hot summer months or due to prolonged drought, or can flood after a particularly strong storm. Despite their importance, there are key gaps in our knowledge of reservoir structure and dynamics. Two recent papers use Landsat data to help fill in those gaps.
Researchers from the University of Southampton used Landsat data to identify where water advanced or retreated from 1984 to 2022, creating the first global dataset pinpointing the exact year of permanent surface water changes—such as when a reservoir formed or a stream dried up. The study can track changes in streams as narrow as 30m and lakes as small as 900m2. In a separate study, Texas A&M University researchers used Landsat data to build a global bathymetry dataset called ‘3D-LAKES’ that enables water managers to estimate reservoir storage capacity.
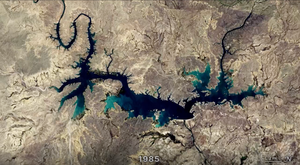
The above animation shows the Amistad Reservoir on the border of Texas and Mexico. It uses a natural-color Landsat image from 1985 overlaid onto a Copernicus Digital Elevation Model (DEM) and bathymetric data from the 3D-LAKES dataset. Vertical relief is exaggerated by a factor of four to emphasize topographic features and landforms. The reservoir is jointly managed by the U.S. and Mexico through the International Boundary and Water Commission (IBWC) for flood control, recreation, and hydroelectric power. Despite its importance to the two countries, the reservoir is slowly shrinking. The surface water transitions dataset shows the water levels retreating in recent decades, with significant recessions between 2012 and 2016. The 3D-LAKES dataset reveals the underwater shape of the reservoir. Together, these datasets complement the in situ water level and conditions data collected throughout the year.
Tracking Surface Water Transitions
Human communities both shape and are shaped by water. We divert rivers, build reservoirs, and construct artificial islands, while natural forces—storms, meandering rivers, and rising seas—reshape our waterways and coastlines. With satellite data as an important tool to study ecosystem dynamics, researchers have begun to build a more comprehensive global understanding of where water is and how it shifts over time. In their water transitions study, the University of Southampton team focused specifically on permanent changes in lakes, rivers, coastlines, and other water bodies worldwide.
Looking at long-term changes in surface water can help scientists understand drivers of change, said Gustavo Willy Nagel, lead researcher on the paper. Knowing when a lake began receding helps water managers investigate whether drought, irrigation, or other forces caused the decline.
Scientists, policymakers, and water managers can explore the interactive dataset that Nagel and his team created to visualize changes close to home as well as stark global impacts such as the drying of the Aral Sea, the lakes created by melting glaciers in Tibet, and the building of the Palm Islands in Dubai.
Assessing long-term changes in surface water presents a key challenge, as surface water is extremely dynamic. Seasonal fluctuations and climatic forces mean that rivers, lakes, and coastlines are changing all the time. To identify permanent water changes while excluding seasonal fluctuations, the researchers ran two algorithms. The first detected whether the water body was advancing or retreating over the study period using the Modified Normalized Difference Water Index (mNDWI), which uses the shortwave-infrared (SWIR) instead of the near-infrared (NIR) band. The second algorithm used the Green_Red Normalized Difference Water Index (grNDWI)—an index proposed by the research team—to identify the precise year that the water body transitioned. A change was considered “permanent” if it did not revert to its previous condition during the study period of 1984 to 2022.
“The dataset is showing, for every location on the planet, areas where water advanced or retracted and the year of that change,” said Nagel.
Visualizing Lakes in 3D
Landsat can help us monitor surface water. But what about what’s under the surface?
In a study published in Scientific Data in October 2025, researchers from Texas A&M University fused Landsat and ICESat-2 data to create bathymetry maps for half a million global lakes and reservoirs. The research team, led by Huilin Gao, used Landsat imagery to calculate the surface area of water bodies, delineate where water meets land, and track how water extent changes over time. Then, they combined laser altimetry from the ICESat-2 satellite to infer the underwater bathymetry of water bodies. With these measurements, the scientists refined area-elevation relationships, a key metric for understanding how water storage changes with water level.
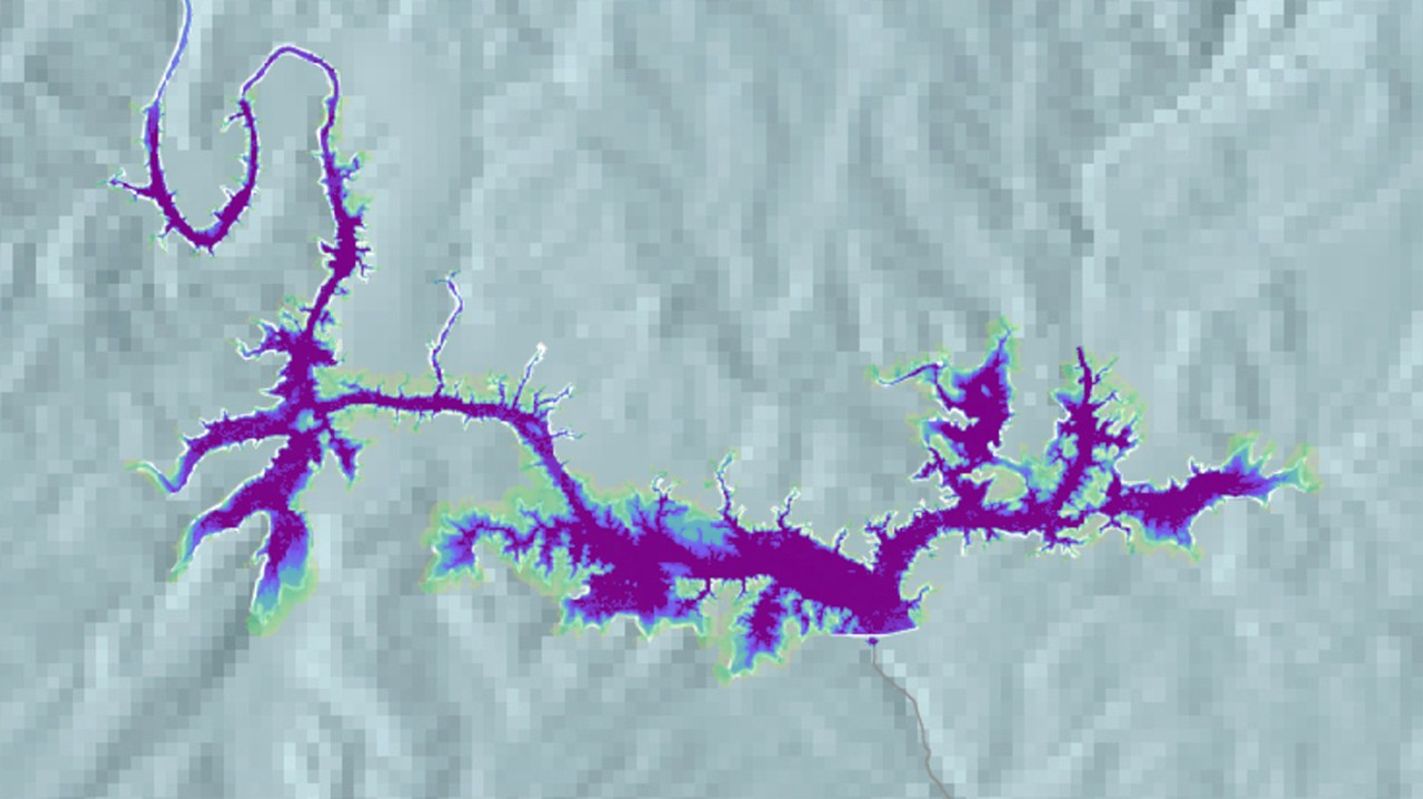
The resultant dataset, dubbed 3D-LAKES, is static, as bathymetry does not tend to change significantly year to year. “This dataset can support many applications, from monitoring water storage to refining hydrological models,” said Chi-Hsiang Huang, the study’s lead author.
3D-LAKES can be used in combination with Landsat-based maps—like the surface transition research or the popular Global Surface Water dataset—to help water resource managers assess the volume of water held in a reservoir or lake. This allows them to evaluate flood risk, map habitat, or calculate how much water is available during a particularly dry season. Researchers can also track changing water volume over time, helping understand long-term trends in water storage.
Measuring underwater topography has historically been expensive and impractical at global scales. The 3D-LAKES dataset now provides researchers and managers with crucial bathymetric data for lakes and reservoirs worldwide. “With this new dataset, we can achieve a more comprehensive understanding of the impacts of lakes and reservoirs on regional climatology, water security, and ecosystem services,” said Gao. Both studies provide water and land managers with unprecedented tools for resource management and planning—from the Amistad Reservoir to the Australian Outback to the Brazilian Amazon.
Explore More
In two recent studies, researchers used Landsat data to fill key gaps in our knowledge of reservoir structure and dynamics.

A network of meltwater lakes and drainage channels made an Antarctic ice shelf known for its blue ice areas even…
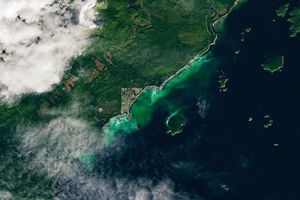
The activity of herring around Vancouver Island in British Columbia brightened coastal waters enough to be detectable from space.


Comments
Post a Comment